Results for ""
DETaiLED 4 Min Read Jun 02, 2021
DETaiLED - Confusion Matrix explained

Confusion matrix is a famous question in many data science interviews. I was confused when I first tried to learn this concept. Also, I tried to find the origin of the term ‘confusion’ and found the following from stackexchange.com
The confusion matrix was invented in 1904 by Karl Pearson. He used the term Contingency Table. It appeared in Karl Pearson, F.R.S. (1904). Mathematical contributions to the theory of evolution (PDF). Dulau and ....
The concept behind the confusion matrix is very simple, but its related terminology can be a little confusing. In this article, I will try to explain the confusion matrix in simpler terms.
What’s happening in our day to day modelling?
1) We are getting a business problem 2) Gathering data 3) Cleaning the data 4) Building all kinds of outstanding models, right? Then, we are getting output in probabilities. Wait Wait Wait! How can we say it’s an outstanding model? One way we can say this is by measuring the effectiveness of the model. Better the effectiveness, better the performance of the model. This is where the term Confusion matrix comes into the picture.
A confusion matrix is a performance measurement technique for Machine learning classification problems. It’s a simple table which helps us to know the performance of the classification model on test data for the true values are known.
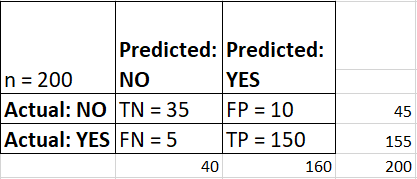
Consider we are doing telecom churn modelling. Our target variable is churn (binary classifier). There are two possible predicted classes: ‘yes’ and ‘no’. 'Yes' means churn (leaving the network) and 'No' means not churn (not leaving the network). Below is our confusion matrix table

- The classifier made a total of 200 predictions (200 customers' records were analyzed ).
- Out of 200 customers, the classifier predicted ‘yes’ 160 times, and ‘no’ 40 times.
- In reality, 155 customers are churn, and 45 customers are not churn .
Let’s see the important terms associated with this confusion matrix with the above example
True Positives (TP): These are the people in which we predicted yes (churn), and they are not leaving the network (not churn)
True Negatives (TN): We predicted no, and they are not leaving the network.
False Positives (FP): We predicted yes, but they are not leaving the network (not churn). It is also known as a “Type 1 error”
False Negatives (FN): We predicted no, but they are actually leaving the network (churn). It is also known as a “Type 2 error”
Just incorporated into our confusion table and added both row and columns
Below terms are computed from the confusion matrix for a binary problem.
Accuracy: How often is the classifier correct?
Accuracy = (TP +TN)/total
Misclassification Rate: Overall, how often is it wrong? It is also called “Error rate”
Misclassification rate = (FP+FN)/total
True Positive Rate (TPR): When it’s actually yes, how often does it predict yes?. It is also known as “Sensitivity” or “Recall”
TPR or Recall = TP/actual yes
False Positive Rate (FPR): When it’s actually no, how often does it predict yes?
FPR = FP/actual no
True Negative Rate (TNR): When it’s actually no, how often does it predict no?. It is also known as “Specificity”
TNR = TN/actual no
Precision: When it predicts yes, how often is it correct?
Precision = TP/Predicted: YES
Prevalence: How often does the yes condition actually occur in our sample?
Prevalence = Actual YES/Total
F Score
It is difficult to compare two models with low precision and high recall or vice versa. So to make them comparable, we use F-Score. F-score helps to measure Recall and Precision at the same time. F1 score is a weighted average score of the true positive (recall) and precision.
Roc Curve:
ROC curve shows the true positive rates against the false positive rate at various cut points. It also demonstrates a trade-off between sensitivity (recall and specificity or the true negative rate).
Keep learning and stay tuned for more!