Results for ""
Data Science 13 Min Read Jan 30, 2023
User Submission - What is Data Modeling, and what steps to build a secure application?

Your company's data will become even more valuable and reliable thought data models that help maintain data integrity. Data in a data warehouse system comes from different sources. Analytical tools, information systems (dashboards), and data mining benefit from the data model.
Data modeling designs the system and defines the database. Any system that stores, creates, or uses data comes in this category. For the business to prosper and to form relationships in data, it is necessary to understand the data.
Learning Objectives
In this article, we will discuss and understand the concept of Data Modeling and the types and tools used for Data modeling.
- Learn conceptual Data Models, Logical Data Models, and Physical Data Models.
- Discuss different techniques for modeling like Hierarchical, Object-Oriented approaches, and Entity relationship models.
- Various tools for Data modeling like Draw.io, Lucid Charts, Datagrip, Amundsen, Enterprise Architect, and ER/Studio.
Table of Contents
- What is Data Modeling?
- Types of Data Modeling
- Why Data Modeling?
- Tools for Data Modeling
- Conclusion
What is Data Modeling?
Data Modeling: - Analyzing data objects and how they relate to others is data modeling. In other words, data modeling is the blueprint used to process the data in a database. A data model comes into action to store the data in a database.
Types of Data Models
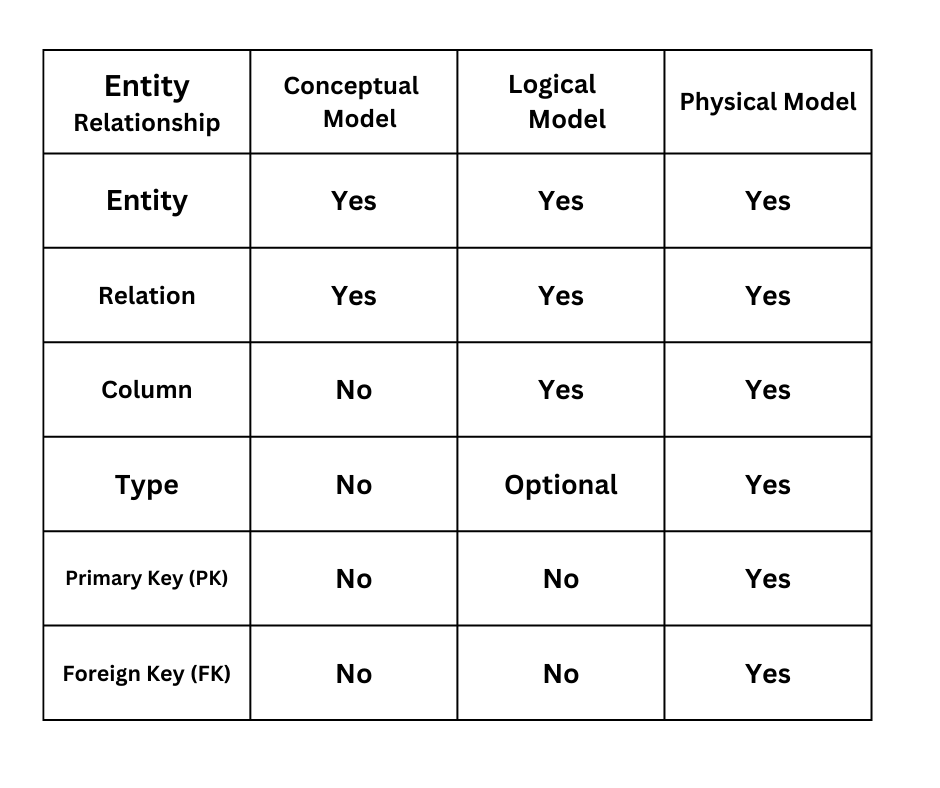
There are three different kinds of data models that we have. The conceptual and Logical model by analyst and data engineer uses the physical model out of both Conceptual and logical models. Entities, characteristics, and relationships are the focus of conceptual and Logical models. Tables, columns, and keys are the focus of physical data models.
Conceptual data models:
It will only show the names of entities and their relationships. The conceptual data model is the first model in data modeling that does not need more details to define the data, which means attributes and data types are absent.
Business people use it to define the business and its requirements and communicate with them.
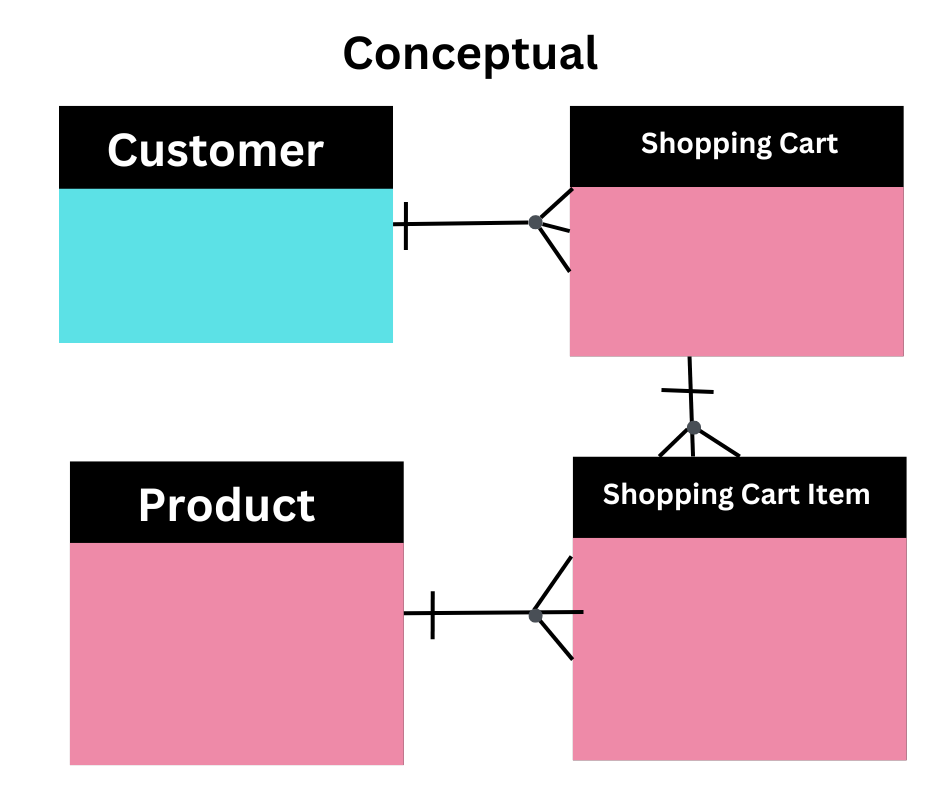
The conceptual model in business.
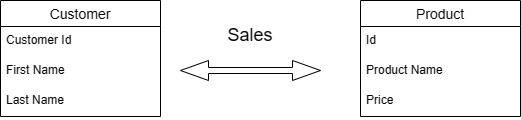
Suppose you own a shopping website app where customers can shop online after registering for the app and logging in with their credentials. The app opens a shopping cart and adds each product the customer stores in the cart. The app reads the details. When the customer checks out, update the shopping cart and generate the final bill with the same information. Additionally, the app stores customer's purchases.
Online Customer, Shopping Cart Item, Product, and Product are the four entities in this ER diagram that represent information about actual objects in our physical database.
Shopping Cart for Online Customers: a relationship that ranges from one option to many.
Shopping Cart_Item in the Shopping Cart: a relationship that ranges from one option to many.
Product_Item in Shopping Cart: a relationship that ranges from one option to many.
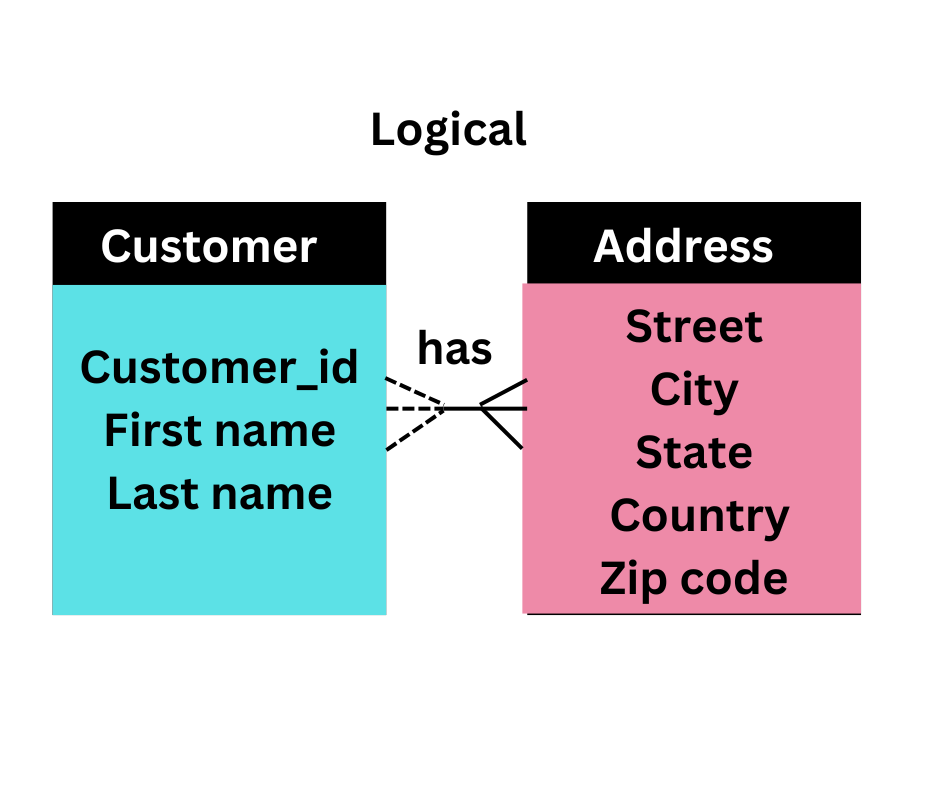
Model of logical data:
Logical Data includes the entity's behaviors, unique keys, relations, names, and foreign keys.
Relationships, unique identifiers, subtypes and supertypes, and constraints between relationships are components of a logical model. It can refer to one or more domains.
A conceptual ERD is a more in-depth version of a logical ERD. The Logical model exists by defining the columns that make up each entity and introducing operational and transactional entities.
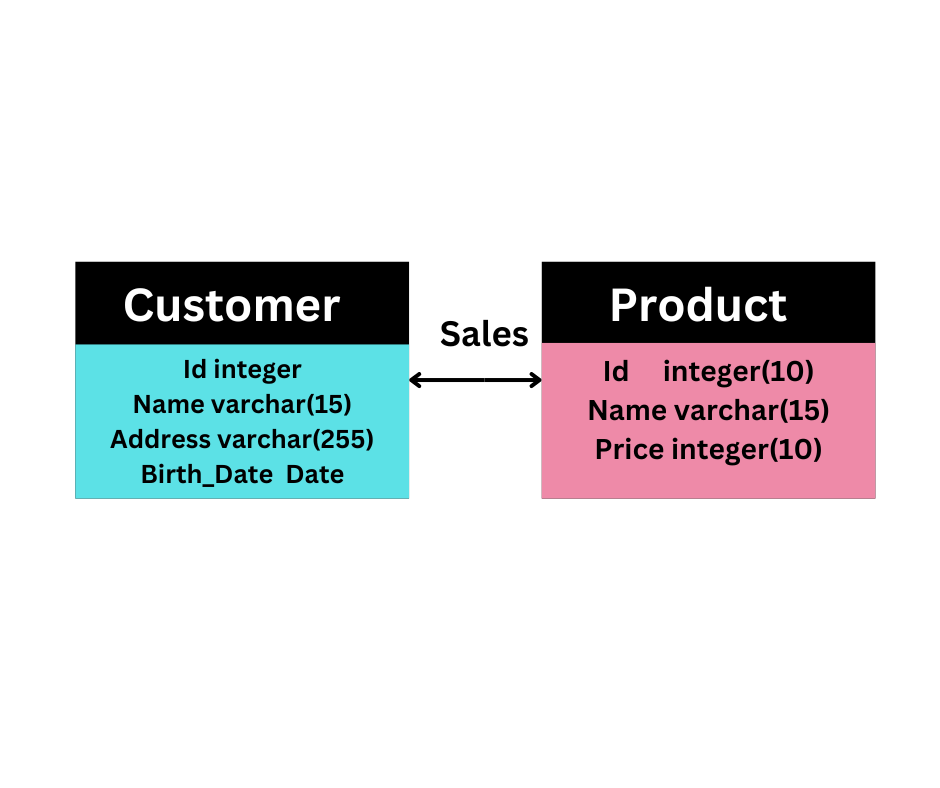
Physical data model:
The relationships between the tables and the keys make up a physical data model. In other words, the components of all logical databases need to make a database referred to as a physical data model.
The unique, foreign keys, column names, data types, and table names are displayed.
You can modify and update the physical data model. Select the queries or statements. In the above example of the customer and product chosen by the customer, integer, first name, last name in varchar, and birth date in date exist.
Why Data modeling?
Data modeling is the process of creating structured data in an information system.
1. The data model can display an organization's data on the same platform. It contributes to the creation of a robust design. With the data model, it is possible to design the database at the logical, physical, and conceptual levels.
2. With the help of a data model, the relation table, and foreign key, concepts get clearer. The redundant and missing data gets identified.
3. It improves the quality of the data and gives a visual representation of the data.
4. As the data model reduced data omission, there was a decrease in the likelihood of inaccurate results and reports.
5. The data analysis gets better because of it. The image we get developers can use to make a physical database.
Although the model takes a lot of time, it makes maintenance cheaper and faster.
Techniques used for Data modeling
1. Hierarchical: The process of grouping things, names, objects, categories, and values in a particular order (from highest to lowest) in a hierarchy.
In the hierarchy, the data closer to each other are gathered compared to other data. A dendrogram shows a graphical view of hierarchical clustering.
Let us take an example, A, B, C, D, E, and F data, and we used a dendrogram to display its graphical view of hierarchy clustering.
The data closer to each other are joined together than other data.
.png)
Code
To display the dendrogram in python scipy function is used.
from scipy.cluster import hierarchy
import matplotlib.pyplot
import numpy
x = numpy.array([100., 200., 300., 400., 500., 250.,
450., 280., 450., 750.])

temp = hierarchy.linkage(x, 'single')
plt.figure()
dn = hierarchy.dendrogram(
temp, above_threshold_color="green", color_threshold=.7)
.png)
Hierarchy clustering in a horizontal way
a = numpy.array([7, 20, 30, 400, 50, 25,
              450, 286, 343, 755])

hlik = hierarchy.linkage(a, 'single')
matplotlib.pyplot.figure()
hd = hierarchy.dendrogram(
    hlik, above_threshold_color="blue", color_threshold=.5, orientation="right")
.png)
2. Model-based on the object-oriented approach
The creation of objects with stored values is the object-oriented approach. While supporting data abstraction, inheritance, and encapsulation, the object-oriented model communicates.
The Object-Oriented Data Model combines a Relational database model and object-oriented programming.
.png)
Class Objects, polymorphism, encapsulation, inheritance, and data abstraction are the fundamental tenets of object-oriented programming (OOP).
.png)
What is a class?
A class represents similar objects that share their behaviors and attributes.
Attributes refer to the character or quality, and behaviors as procedures or methods.
A class keyword represents the Class.
class Car:
    color ='red';
    wheels=4;
print(Car)
What is an object?
An object is a blueprint or copy of a class.
van=Car()
van.color="green"
print(van.color)
Encapsulation
The process of wrapping the data (variables) and the code that processes the data as a single unit is an encapsulation.
Suppose we have an account, financial, and sales team in the store company, and the sales data team wants to access the current data related to sales.
The sales team can access the data without permission, and if the sales team wants to access the account data, one can't access the data and will need permission from the account team.
Inheritance
In science, we study that offsprings inherit traits or genes from Parents.
.png)
The concept is similar in python, where if class B inherits the properties of class A, then subclasses of B automatically inherit all the properties of class A.
Code
class Car1():
    def __init__(self):
        self.color1 = "Red"
        print("Car1")
class Car2():
    def __init__(self):
        self.color2 = "white"
        print("Car2")
class Cars(Car1, Car2):
    def __init__(self):
        Car1.__init__(self)
        Car2.__init__(self)
        print("Cars")
    def colors(self):
        print(self.color1, self.color2)
object1 = Cars()
object1.colors()
Output
Car1 Car2 Cars Red white
Abstraction
A class is abstract if it has one or more abstract methods.
The Python library's "ABC" module provides the infrastructure for customizing abstract base classes.
from abc import ABC, abstractmethod
class Polygon(ABC):
    def side(self):
        pass
class Triangle(Polygon):
    def side(self):
        print("Triangle have 3 sides")
class Pentagon(Polygon):
    def side(self):
        print("Pentagon have 5 sides")
A = Triangle()
A.side()
S = Pentagon()
S.side()
Output
Triangle has 3 sides Pentagon has 5 sides
3.Entity-relationship Model
An entity-relationship model (ER model) is a high-level relational model used to define the relationship between system entities and their data elements.
An entity-relationship diagram, which includes Entities, Attributes, and Relationships, is used to depict the entire database in this model.
Entities are real-world objects.
In the classroom, entities are teachers, students, courses, etc. Some entities are weak and depend on Strong entities. Strong entities are not dependent on weak entities.. The professor is an example of a strong entity. The entity is shown in a rectangle and can have many relations with other entities.
.png)
Each entity has its properties known as attributes.
Ellipse shape for attributes in the ER diagram.
.png)
Relationships come in four distinct varieties. They are:
.png)
1 to 1: When only one sample of an entity makes the relationship means 1 to 1.
1 to N: When more than one sample of an entity makes relations with many.
N to 1: Relationship linked to more than one sample of an entity.
N to N: An entity having a relationship on the right and left is called N to N.
.png)
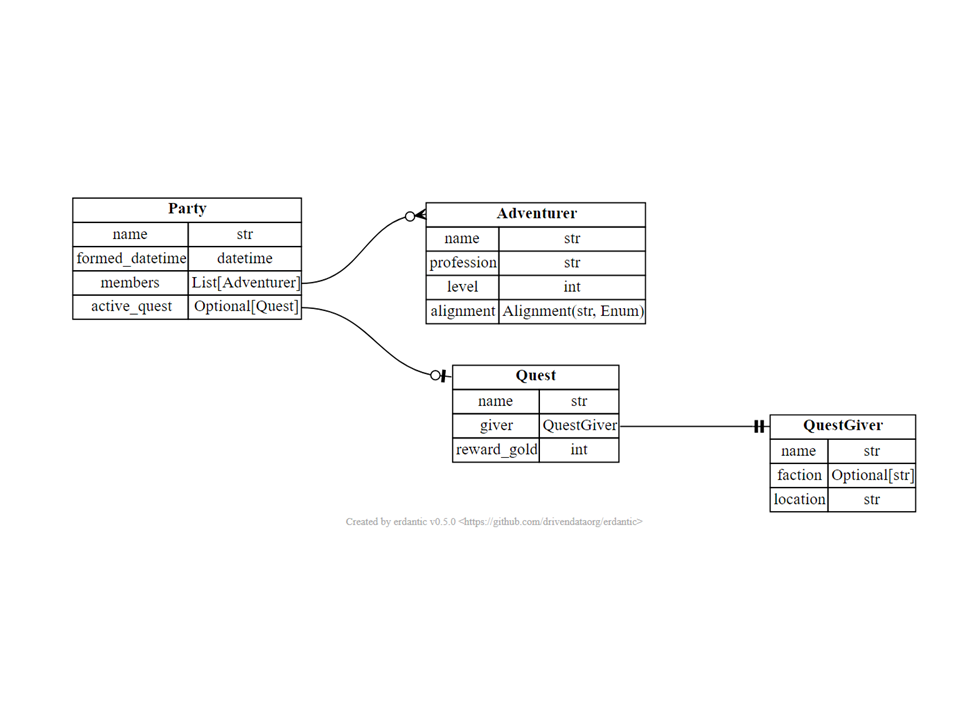
For Python data model classes, erdantic is a tool for drawing entity relationship diagrams (ERDs).
The renowned Graphviz library renders drawings.
conda install erdantic -c conda-forge
import erdantic as erd
from erdantic.examples.pydantic import Party
diag = erd.create(Party)
diag
Data modeling facilitates data's visual representation.
Open-source solutions like Open ModelSphere are among the free tools for data modeling.
By using different data modeling techniques, we perform data analysis.
Data elements are standardized in their relationships to one another and real-world entities through a data science model. Data science is not only a science but also an art.
Tools for data modeling
The tools available for data modeling are as follows:
1. Draw.io
2. MySQL Workbench
3. Lucidchart
4. Datagrip
5. Amundsen
6. ER/Studio
7. Enterprise Architect
1. Draw.io
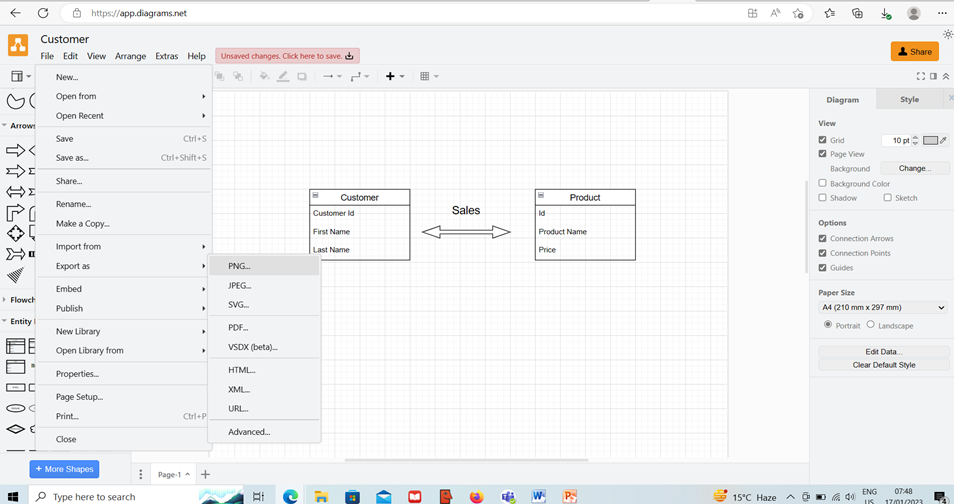
The draw.io is a free handy flowchart that drags the figure needed for the entities and the lines to join them on the canvas.
Use the Diagram editor to create a new diagram. The Basic template section and a Blank Diagram are the default options in the Template Manager. Click on Create (or double-click on Blank Diagram) and give the diagram a name. On the left side of the editor, add a random shape from the General shape library. Select "Save & Close."
On the left side panel are the shapes of different types based on the requirements you can drag and drop on the canvas. On the right side is the style button, where you can use the style you want, and the diagram button, where you can change the color.
Use the download button to save the diagram. You can save it on the drive or git or download it.
You can save the diagram in png, jpg, SVG, etc.
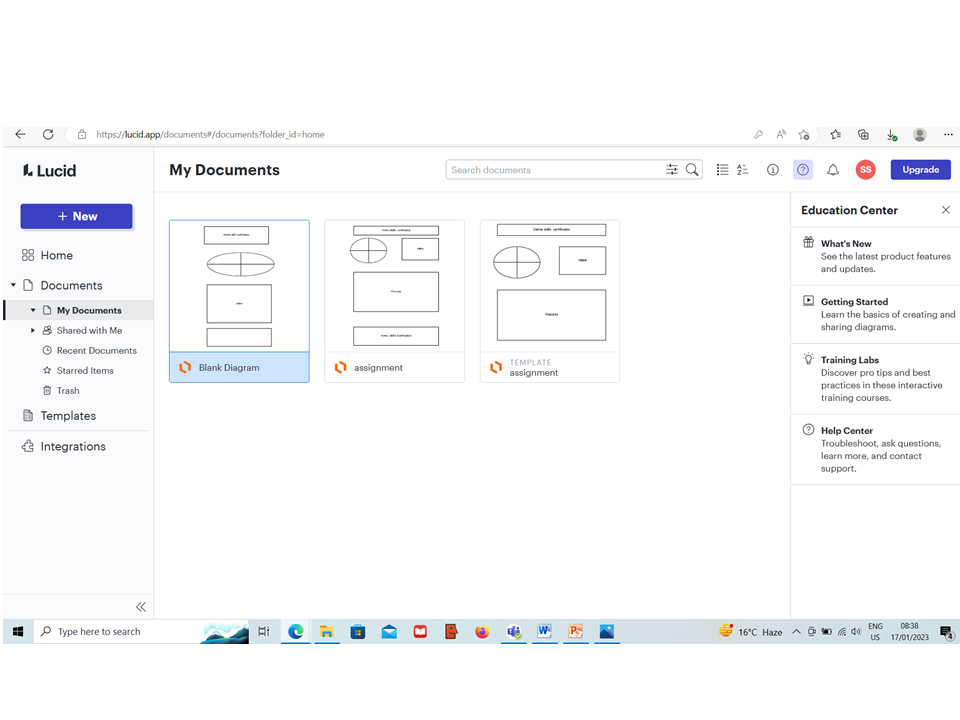
2. Lucid Charts
The lucid charts follow similar tools but differ in the unlimited plan as paid, and one connects with the SQL to make the database system.
You can create a new document by clicking on the new button or choose the templates or recent documents created depending on the choice.
3. My SQL Workbench :
MySQL Workbench is a graphical or designing tool for working with MySQL databases and servers.
The MySQL Workbench has the following features:
With the Development feature, you can use the built-in SQL Editor to create and handle connections to database servers and implement SQL queries.
Table Editor edits every aspect of your database, reverses and forwards engineer between a schema and a live database, and creates graphical models of your database's schema.
You can administer MySQL server samples by users, carry out backup and recovery, inspect data, witness database health, and monitor the performance of the MySQL server using this functionality.
You can transfer tables, objects, and data from Microsoft SQL Server, Microsoft Access, and other management systems to MySQL with the help of Data Migration.
MYSQL Enterprise Support products like MySQL Enterprise Backup, MySQL Firewall, and MySQL Audit.
4. Datagrip
The Data grip is a cross-platform IDE that doesn't requires Java installation but has Jet Brains Toolbox runtime similar to JRE.
The Jet Brains toolbox app installs Jet Brains and maintains all the projects based on it.
5. Amundsen
is a metadata engine that indexes data resources like tables, dashboards, streams, and so on and generates a page-rank-style search based on usage patterns.
6. Enterprise Architect
is a tool for visual modeling and design that models software applications, databases, information systems, and architectures. Standards and object-oriented languages are their foundation.
7. The database design software ER/Studio
is compatible with the most widely used database management systems. Relational and dimensional data modeling are both supported by it.
Conclusion
Visual representation to show the relationship between data points is data modeling.
Analyzing the data requirements necessary for the business processes is where this tool comes into play.
The building plan of an architect is the Data Model. It is the process of creating a diagram that depicts the intricate design of a software system. Text and symbols show how the data will flow. It is the blueprint for developing new software or re-engineering an existing application.
Hierarchy, object-oriented, and Entity relationship are different techniques used by data science for data modeling.
Key Points
In this article, we learned various points about data modeling that we wrote below.
1. It helps in the reduction of errors in the development process of software and database.
2. Enhance enterprise-wide consistency in system design and documentation.
3. Enhance the performance of the application and database.
4. Facilitate data mapping.
5. Enhance developer-to-business intelligence team communication.
6. Facilitate and accelerate conceptual, logical, and physical stages of design.
Developers, data architects, analysts, and stakeholders can view and grasp relationships between data in a database or data warehouse with data modeling.
Sources of Article
Entity Object Relationship