Results for ""
Risk Identification and Assessment Tool
Our risk identification and assessment tool is intended to help AI-led enterprises to adopt and implement effective risk management strategies. Using our tool, enterprises should be able to visualise the likelihood, impact, and velocity of potential risks arising from the development and deployment of AI solutions for prioritised mitigation. The tool could also help communicate enterprise vulnerabilities and risk tolerance thresholds to help management take necessary and appropriate calls to continue, discontinue, or closely monitor the development and deployment of an AI solution.
To get started, follow the steps below:
Risk identification
1
Identify all potential risks from the development and deployment of a given AI solution. To help enterprises do this, in Part 1 of the tool, our AI Risk Library provides a comprehensive but non-exhaustive list of common potential risks that enterprises operating across sectors and AI use-cases could take into account for monitoring, assessment, and mitigation purposes to ensure responsible development and deployment of their AI solutions.
Note that not every risk in the risk library would be applicable to every organisation and use-case. The key consideration at this stage is to identify the specific risks from the risk library that are applicable to a specific organisation, depending on the use-case it seeks to develop and deploy.
Risk Evaluation
2
For each of the identified risks from Step 1, the organisation needs to evaluate both their impact (I) and likelihood (L). Impact is how much disruption a risk could potentially cause if it materialises and it is derived as the highest score of seven impact categories (refer Part 2 of the tool). Likelihood is probability of a risk materialising and it is derived on a scale of 1-5 (refer Part 3 of the tool).
A risk score is calculated for all identified risks as the product of their I and L scores. Risks are then categorised into high, medium, and low based on this score. Risks with risk scores greater than or equal to 15 is deemed to be high, those with scores between 10 and 14 is deemed to be medium, and those with scores less than 10 is deemed to be low.
There are two other parameters for evaluating an identified risk, namely risk velocity score and enterprise vulnerability score. Parts 4 and 5 of the tool define the criteria for their calculation on a scale of 1-5.
Risk Visualisation
3
As a final step in risk assessment, a risk heat map is plotted for all identified risks with their likelihood scores on X axis and impact scores on Y axis. Risk scores calculated at Step 2 are plotted on the map by the colours red, yellow, and green, indicating high-risk, medium-risk, and low-risk categories respectively. Risk velocity and enterprise vulnerability scores are represented on the map as black and blue bubbles respectively. The bigger the size of the bubble, greater would be the velocity or vulnerability.
The risk heat map should help organisations visualize the risks arising from an AI solution and prioritise their efforts accordingly to mitigate or remediate these risks. Part 6 of the tool contains an illustration of a risk heat map.
1. AI Risk Library
| Risk Category | S.no. | Potential Risks | |
|---|---|---|---|
| Strategic | 1. | AI strategy not in sync with organisational strategies or value system or risk appetite leading to ineffective or even malicious/unethical models | |
| 2. | Lack of vision from the management on AI adoption might lead to lesser trust in organisations and individuals to innovate | ||
| 3. | Lack of complete inventory of critical AI solutions and knowledge about interdependencies between models may lead to implementing a solution which is not aligned with business objectives | ||
| Financial | 4. | Direct financial losses due to incorrect models being created and inefficient use of resources | |
| 5. | Reputational losses as a result of AI models going wrong | ||
| 6. | Lack of clarity in terms of what is possible and what is not and the cost associated with it leading to mismanagement of resources | ||
| Data | 7. | Risk of test data being very different from the production data leading to inaccurate or biased models | |
| 8. | Risk of non-availability of appropriate and accurate or unbiased data to develop and train models | ||
| 9. | Un-approved or unauthorized access (including privileged access) to the AI models or the data used to train models may result in solutions not meeting business objectives | ||
| 10. | Lack of proper segregation or tagging of data based on sensitivity leading to inappropriate control measures to safeguard them | ||
| Technology | 11. | Lack of auditability (black box effect) or non-availability of audit logging due to inherent limitations in technology being used | |
| 12. | Lack of proper monitoring mechanism to handle inconsistencies/address grievances arising from the model output (insufficient learning feedback loop), and make timely corrections including a possible roll-back if required | ||
| 13. | Lack of redundancy (fall back option) leading to single point of failures for these models which may impact business outcomes | ||
| 14. | Rigidness of the technology to scale the implementation as the organization moves forward | ||
| Algorithmic | 15. | Biased data used to train AI models resulting in biased and unreliable AI models being created | |
| 16. | Lack of risk-based stress testing techniques and documentation leading to biased and unreliable models being built | ||
| 17. | The logic behind AI solution not being transparent (black box) without any supporting documentation leading to adverse regulatory implications for the organisation | ||
| 18. | Secure coding practices and supporting documentation not being maintained during the deployment life cycle, creating vulnerabilities for exploitation by bad actors | ||
| 19. | Un-approved or not well-tested or not well-documented changes (inadequate UAT) logic movement to production can lead to incorrect outputs impacting business and causing financial and reputational losses | ||
| 20. | Flaws in model design causing inability to trace back the activities performed by or through an AI system to a bot or user account, which in turn hinders logging and monitoring activities and causes loss of accountability | ||
| 21. | Lack of mechanisms to verify if the model continues to work as intended (model drift) in the changing environment | ||
| Cyber (Privacy and Security) | 22. | Data used (including PII and PHI) in AI models not secured enough allowing it to be used beyond its intended and stated use | |
| 23. | Customers unable to opt-in and opt-out from sharing their private information | ||
| 24. | Organisations using data without explicit consent of data principals or using it outside the bonafide need for which it was collected leading to privacy harms | ||
| 25. | Lack of adequate access controls in place to safeguard manipulation of data or logic used leading to inability of these models to respond accurately to certain inputs | ||
| People | 26. | Risk to organisational talent culture (skills atrophy) due to AI implementation which may lead to employee resentment | |
| 27. | Lack of adequate skilled and trained talent to build, train, test, deploy, and maintain AI models | ||
| 28. | Lack of clearly defined roles and responsibilities for development, testing, maintenance, monitoring and governance of AI models leading to lack of accountability and unapproved deployments | ||
| 29. | Lack of clarity/documentation/training on how human machine interactions should happen during the entire model life cycle resulting in loss of human oversight over the model | ||
| 30. | Loss of organisational expertise or knowledge limiting the capacity of human intervention to circumvent harms from model or data drifts | ||
| 31. | Non-diverse and non-inclusive work force leading to development of potentially biased or unfair models | ||
| Regulatory | 32. | Lack of clarity on regulations governing various components of the model value chain resulting in regulatory non-compliance and associated financial penalties and litigation costs for the organization | |
| 33. | Absence of a designated internal governance body or mechanism to monitor and control malicious use of AI, leading to reputational and associated financial losses for the organisation | ||
| 34. | Disaster recovery plans not in place in case of an unexpected event (e.g., cyber attacks) to limit the financial and reputational losses for the organization | ||
| External | 35. | Non-availability of AI solutions due to network or connectivity issues leading to incorrect or untimely decisions from the models | |
| 36. | Incomplete and inaccurate interfaces between different AI solutions, data sources which might lead to failure of the AI model | ||
| Third Party or Fourth Party | 37. | Lack of clarity in terms of roles and responsibilities of vendor or third party involved in model life cycle leading to lack of accountability | |
| 38. | Ineffective risk management due to lack of clarity in contractual terms governing parties involved in the model value chain (e.g., lock-in period, intellectual property rights, support period) | ||
| 39. | Lack of internal controls or security and privacy protection protocols in model implementation by third party vendor(s) | ||
| 40. | License requirements of vendors not being met might lead to hefty fines and reputation losses | ||
| Societal | 41. | Indifference of organisations to the societal impact of AI leading to erosion of consumer trust | |
| 42. | Non-transparent AI models unfairly excluding certain individuals or sections of the society from accessing AI-driven services, opportunities and benefits | ||
| 43. | Widening socio-economic inequality caused due to automation of repeatable and predictive tasks in the society | ||
2. RISK IMPACT SCORE CALCULATION
The impact score (I) for an identified risk will equal the highest score of any of the seven impact measure or parameter scores, on a scale of 1-5, in the table below:
| Impact Category | Measure/Parameter | Indicator | Rating (1-5) |
|---|---|---|---|
| Impact Scale in 1% | |||
| Financial | Revenue: Achieve target revenue | Revenue impact in $ million | |
| Gross Margin: Maintain healthy gross margin | Loss of Gross Margin in % | ||
| Contracted Annual Recurring Revenue (CARR): Achieve target CARR | CARR impact in $ million | ||
| Strategic | Strategic Impact: Achieve target growth rates for the company. A decline in CAGR will directly impact the revenue of the organization. | Loss of CAGR % in terms of revenue | |
| Legal and Regulatory | Regulatory Non- Compliance: Non- compliance with applicable legislation, rules, and regulations | Scope of impact from a regulatory perspective | |
| Brand and Reputation | Brand Sentiment or Value: Manage brand sentiment of the company | Scope of impact from a reputational perspective | |
| Information Technology | Information Security: Protect organisation’s and its customers' information and assets | Vulnerabilities detected leading to security or privacy concerns | |
3. RISK LIKELIHOOD SCORE CALCULATION
The likelihood score of an identified risk will be calculated, on a scale of 1-5, as per the criteria provided in the table below:
| Likelihood | Description | Probability | |
|---|---|---|---|
| Almost Certain | 5 | Event expected to occur in most circumstances | 81%- 99% |
| Likely | 4 | Event could probably occur in certain circumstances | 61%- 80% |
| Possible | 3 | Event should occur at some time | 41%- 60% |
| Unlikely | 2 | Event could occur at sometime | 21%- 40% |
| Rare | 1 | Event may occur, but only under exceptional circumstances | 1%-20% |
4. RISK VELOCITY SCORE CALCULATION
The velocity score of an identified risk will be calculated, on a scale of 1-5, as per the criteria provided in the table below:
| Rating | Description |
|---|---|
| 5 | Very rapid onset, with little or no warning - onset occurs in a matter of hours to few days from event to impact - instantaneous |
| 4 | Onset occurs in a matter of days to a few weeks from event to impact |
| 3 | Onset occurs in a matter of few months to a quarter from event to impact |
| 2 | Onset occurs in a matter of several months to a year from event to impact |
| 1 | Very slow onset, occurs over a year or more from event to impact |
5. ENTERPRISE VULNERABILITY SCORE CALCULATION
The enterprise vulnerability score for an identified risk will be calculated, on a scale of 1-5, as per the criteria provided in the table below:
| Criteria | 1 | 2 | 3 | 4 | 5 |
|---|---|---|---|---|---|
| Current levels of countermeasures | BOTH | BOTH | BOTH | EITHER | EITHER |
| Responsible organisations or functions are identified | Responsible functions are identified and accountability is firmed up | Responsible functions are identified and accountability is being firmed up | Responsible functions are identified, but accountability not yet determined | Responsible functions are not identified | |
| AND | AND | AND | OR | OR | |
| Countermeasures are implemented and reviewed regularly | Countermeasures are implemented | Countermeasures are identified and in the process of being implemented | Implementation of countermeasures is delayed | Countermeasures are not implemented | |
| Complexity of response required | Standard response with negligible cost and minimal effort - also, ample time available to respond | Standard response with negligible cost and minimal effort - also, some time available to respond | Non-standard response with some cost and effort - also some time available to respond | Non-standard,time-bound, resourceintensive response | EITHER Crossfunctional or regional response OR Significant cost and resource required to respond OR Sudden event with less time to respond |
6. RISK HEAT MAP
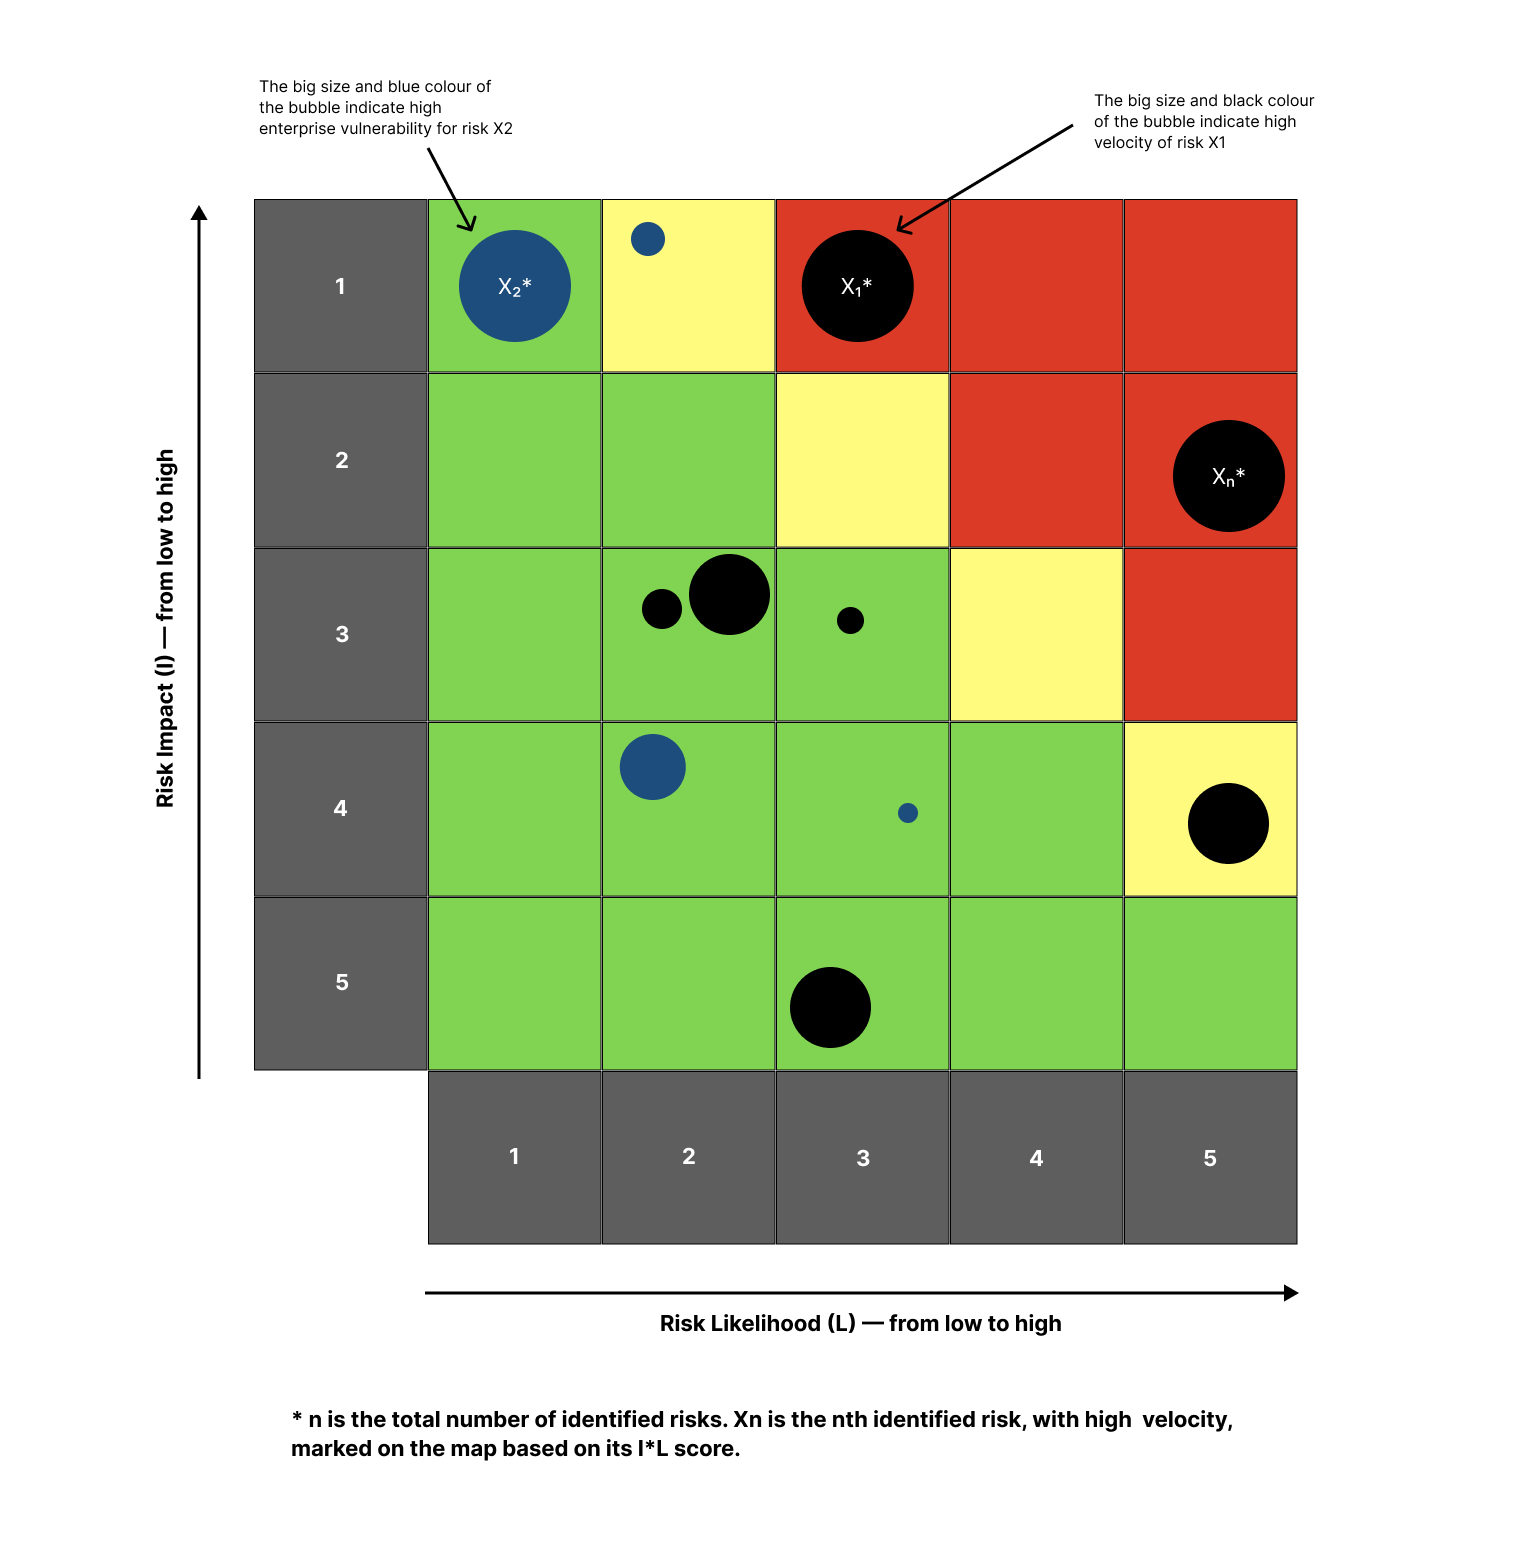
The risk assessment scores (or values of I*L for all identified risks) are plotted on a graph with “Risk Impact” on the vertical Y axis and “Risk Likelihood” on the horizontal X axis to generate a risk heat map for a given AI solution. These risk assessment scores could be segregated into high, medium, and low-risk categories, represented on the heat map by the colours red, yellow, and green respectively, based on the risk appetite of the enterprise. For illustrative purposes, a risk rating criteria is defined for an AI-led enterprise with a certain risk appetite below:
If the value of I* L for an identified risk is greater than or equal to 15, the risk is deemed high and should be given the highest priority. If the value is 10 to 14, the risk is deemed medium and should be given moderate priority. If the value is less than 10, the risk is deemed low and should be given the lowest priority. If an AI solution is classified as high-risk, according to the above risk rating criteria, it should be either discarded and/or closely monitored.
Risk velocity scores or enterprise vulnerability scores for identified risks could be represented on the heat map as black and blue bubbles respectively, the bigger the size of a bubble, the greater the velocity or vulnerability, as the case may be.
Hence, a risk heat map could help enterprises visualise the likelihood, impact, and velocity of potential risks arising from the development and deployment of AI solutions for prioritised mitigation, as part of their effective risk management strategies. It could also help communicate enterprise vulnerabilities and risk tolerance thresholds to help management take necessary and appropriate calls to continue, discontinue, or closely monitor the development and deployment of an AI solution.
See Figure 1 below for an Illustration of a Risk Heat Map